Sino-Tanzania collaboration boosts the improvement of water and air environment in the near-lake area of Lake Victoria
2026-01-30
Some bays of the Lake Victoria are now facing with the severe problem of Lake Eutrophication, which is mainly caused by the nitrogen (N) discharged from crop farming in the lake bay areas. While the farmers' behaviors affect directly on the N discharged from crop farming.The Sino-Tanzania cooperation project, a part of the International Partnership Program of the Chinese Academy of Sciences is led by Dr. XIONG Chuanhe from the Nanjing Institute of Geography & Limnology (NIGLAS). The project is dedicated to addressing the issues and improving the water and air environment in the near-lake area.Recently, the project conducted on-site investigations to three villages in the Mwanza Lake Bay area of Lake Victoria: Sweyavillage, Kisoko, and Kigoto. Through communication with village leaders, reviewing production records, and conducting on-site estimations, the project investigated the land use and input-output conditions.During the on-site investigations, the project team also conducted interviews and questionnaires with farmers, gaining a comprehensive understanding of the household characteristics, main agricultural production behaviors, awareness of agricultural non-point source pollution, and coping abilities of farmers in dealing with non-point source pollution.The project clarified the main farming behaviors of farmers in the Victoria Lake Basin that have an impact on nitrogen discharge in the area, as well as the extent of such impact. It also revealed the specific mechanisms by which farmers' capabilities and cognition play a role in decision-making regarding the main farming behaviors that have an impact on nitrogen discharge."These efforts enhance China's international reputation in environmental conservation, " said by Dr. XIONG. Economically, the research on nitrogen discharge in lake bay area will help improve water and air quality in surrounding regions, supporting agricultural productivity and local farmers' livelihoods. Socially, the project fosters capacity-building for environmental protection and sustainable development across Africa.
National Key Research and Development Program Plan (Sino-Mongolian international cooperation project) Successfully Convoked in Nanjing and Bayannur
2023-09-11
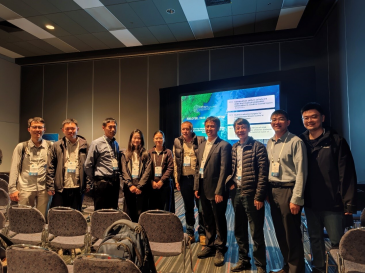
On September 4th to 7th, 2023, the symposiums on the establishment and implementation of the National Key Research and Development Program of China, i.e. Sino-Mongolian Intergovernmental Joint Research Program: The impacts of global change on nutrient cycles and ecosystem evolution in shallow lakes in Sino-Mongolian cold-arid area (No. 2023YFE0100500) were successfully held in Nanjing and Bayannur.
Prof. ZHANG Ganlin, the director of Nanjing Institute of Geography and Limnology, Chinese Academy of Sciences (NIGLAS), delivered a welcoming address on behalf of the host institution. Dr. Odsuren, the scientific secretary of the Institute of Geography and Geoecology, Mongolian Academy of Sciences (IGG, MAS) made a detailed introduction of IGG, MAS.
After that, the project leader Dr. HAN Chao, introduced the current state of lake ecosystems in China and presented a comprehensive report on the overall research objectives, content, implementation plan, expected outcomes, innovative aspects, task decomposition, and progress schedule of the joint project. Followed, Dr. Narangerel from IGG, MAS presented a detailed introduction to the research team's prior achievements in the field of lake science in the cold-arid regions of Mongolia and the current ecological environment of Lake Ugii.
During the local coordination symposium held in Bayannur, Inner Mongolia, Director Bao Wei from Wuliangsu Lake Ecological Protection Center extended a warm welcome to the attending experts. He emphasized that this project was a significant decision and deployment for the protection and comprehensive management of Wuliangsu Lake, which would effectively support the ecological environment protection on Wuliangsu Lake. Subsequently, the joint program teams carried out discussions and communications with the local administrators regarding the implementation plan, research platform status and infrastructure, data collection and sharing, preparation of field instruments and equipment, training of young researchers, and fieldwork plans. After the meeting, all members conducted the field surveys on Wuliangsu Lake.
More than 20 experts and major leaders from NIGLAS, IGGMAS, and Wuliangsu Lake Ecological Protection Center participated in the symposiums. It further expanded the researcher exchanges and cooperation, promoted friendly contacts and mutual understanding between the two sides, which played a significant role in facilitating the smooth implementation of the joint project.
(photo by NIGLAS)
Synergistic effects of warming and internal nutrient loading interfere with the long-term stability of lake restoration and induce sudden re-eutrophication
2023-02-27
Urban lakes are globally ubiquitous and are usually highly eutrophic, pointing to an increase in frequency, duration and magnitude of harmful algal blooms as wide-spread threats to ecological and human health.
Over half a century, phosphate (P) precipitation is among the most effective treatments to mitigate eutrophication in these lakes. However, after a period of high effectiveness, re-eutrophication would possibly occur leading to the return of harmful algal blooms. While such abrupt ecological changes were presumably attributed to internal P loading, the role of lake warming and its potential synergistic effects with the internal loading, thus far, has been largely understudied.
Researchers led by Dr. KONG Xiangzhen and Prof. Dr. XUE Bin from the Nanjing Institute of Geography and Limnology of the Chinese Academy of Sciences, along with their international collaborators, have addressed the question by quantifying the contributions of lake warming and the potential synergistic effects with internal P loading in an urban lake located in central Germany, which suffered from the abrupt re-eutrophication and cyanobacterial blooms in 2016 (30 years after the first P precipitation).
Their findings were published in Environmental Science & Technology on Feb. 20.
In this study, a process-based lake ecosystem model (GOTM-WET) was established using a high-frequency monitoring dataset covering eutro-/oligo-trophic states over 30 years.
Model analyses suggested that, for the abrupt occurrence of cyanobacterial blooms, internal P release accounts for 68% of the biomass proliferation, while lake warming contributed to 32%, including both direct effects via promoting growth (18%) and synergistic effects via intensifying internal P loading (14%). The model further revealed that the synergy was attributed to prolonged lake hypolimnion warming and oxygen depletion.
“Our study exemplifies how process-based mechanistic modeling could help to tease apart important drivers of abrupt shifts and cyanobacterial blooms in lakes, particularly in an era of rapid global changes including climate change and human activities.” said Dr. Kong.
This study unravels the substantial role of lake warming in promoting cyanobacterial blooms in re-eutrophicated lakes. The indirect effects of warming on cyanobacteria via promoting internal loading need more attention in future lake research and management.
“Our findings will have far-reaching consequences for lake restoration and management as the nutrient targets we applied so far to reach or maintain a certain trophic state will not work in a far warmer future and need to be adjusted, i.e. stronger nutrient level reduction and higher efforts in restoration are demanded.” said Dr. Kong.
link: https://pubs.acs.org/doi/10.1021/acs.est.2c07181
Contact
TAN Lei
Nanjing Institute of Geography and Limnology
E-mail: ltan@niglas.ac.cn
Sediment organic matter properties facilitate understanding nitrogen transformation potentials in East African lakes
2022-10-20
East African lakes include the most productive and alkaline lake group in the world. Yet, they generally receive fewer nutrient inputs than the densely populated subtropical and temperate lakes in the northern hemisphere. In these lakes with insufficient supplies of inorganic nitrogen, the mineralization of benthic organic matter can play an important role in driving the nutrient cycle and nitrogen loss. Using a suite of stable 15N isotope dilution and tracer techniques, we examined five main processes of the sediment nitrogen cycle in 16 lakes and reservoirs of Tanzania and Kenya, East Africa: gross nitrogen mineralization, ammonium immobilization, dissimilatory nitrate reduction to ammonium (DNRA), and the dinitrogen (N2) production via denitrification and anaerobic ammonium oxidation (anammox). Gross nitrogen mineralization and ammonium immobilization showed the maximum values of 9.84 and 12.39 μmol N kg-1 h-1 , respectively. Potential DNRA rates ranged from 0.22 to 8.15 μmol N kg-1 h-1 and accounted for 10 %–74 % (average 25 %) of the total dissimilatory nitrate reduction. Potential nitrate reduction rates in most lakes were dominated by denitrification with a contribution of 26 %–85 % and a mean of 65 %. We further found that the sediment nitrogen transformations were driven mainly by benthic organic matter properties and water column phosphate concentrations, reflecting microbial metabolic responses to the changing carbon and nutrients availability. For instance, autochthonous production of protein-like organic matter attributed to active sediment nitrogen mineralization, DNRA, and denitrification. In contrast, the high degree of humification caused by the inputs of terrestrial humic-like substances slowed down the sediment nitrogen transformations. The contribution of DNRA to total dissimilatory nitrate reduction was significantly positively correlated to sediment C: N ratios. These results indicate that predictions of sediment N supply and loss in East African lakes can be improved by incorporating sediment organic matter properties.
Xiaolong Yao, Zhonghua Zhao, Jianjun Wang, Qiqi Ding, Minglei Ren, Ismael Aaron Kimirei, Lu Zhang, Sediment organic matter properties facilitate understanding nitrogen transformation potentials in East African lakes, Science of The Total Environment, 841, 2022, 156607, https://doi.org/10.1016/j.scitotenv.2022.156607.
More